Assalamu'alaikum w.b.t.
We are students from Section 2, Psychological Statistic (PSYC 1998),
would like to present on our group project for the requirement of this subject.
Our group members consist of:
Ajda Nuha binti Ahmad Daniel (1526206)
Ili Hanani binti Baharon (1625100)
Munifah Tasnim binti Muhamad (1629560)
Siti Arbaiah Khairiah binti Osman (1620420)
Siti Nursyahirah Atikah binti Mahasan (1626646)
Syafaf 'Aisyah bt Khiri (1620964)
For this project, we have decided to use Social Physique Anxiety Scales and Physical Activity and Sports Anxiety Scales for our survey and we used Statistical Package for
Social Science (SPSS) to perform the statistical analysis.
Below are the steps on how we perform the statistical analysis.
A.DESIGNING THE QUESTIONNAIRE
Firstly, we create the questionnaire through Google Form. The questionnaire consist of three sections which are;
a) Demographic
b) Social Physique Anxiety Scales
c) Physical Activity and Sports Anxiety Scales


1. RAW DATA (EXCEL)
After we received enough responses from our questionnaires, the data were then exported to Microsoft Excel file.


2. CREATING SPSS DATAFILE

Firstly, open SPSS and click on Variable view. Then, key-in the variables for the statistical test.

Then, click on Data View and key in the data for each variables.
3. CODEBOOK
After all data have been entered, we prepared a codebook to check any missing values.

Click on Analyze >>>Reports>>>Codebook.

In Variables tab, move the variables you want to the Codebook Variables box.
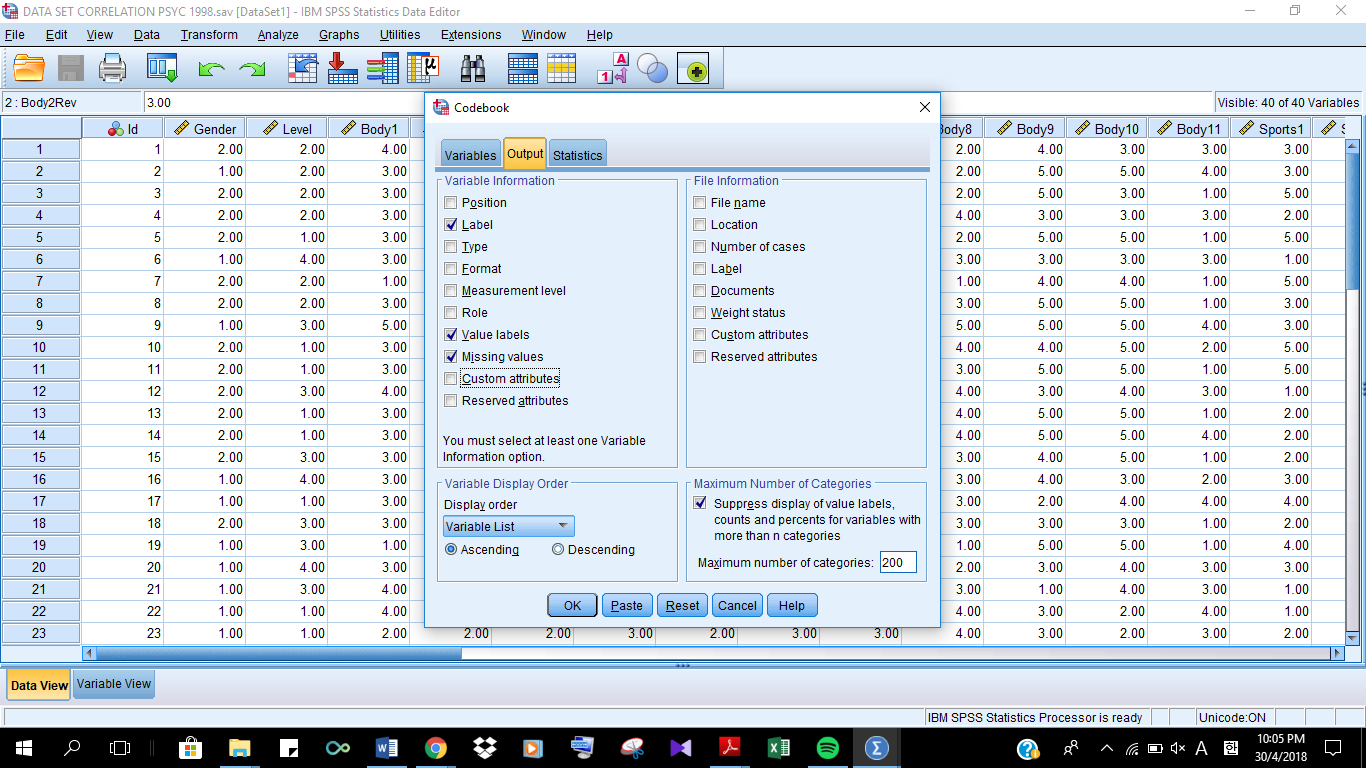
In Output tab, tick on Label, Value label and Missing values.

In Statistic tab, tick all options on both sections. And then, click OK.
These are the Codebook Outputs:

4. SCREEN, CLEAN AND PREPARE DATA
Next, we checked for any data entry errors.

Click on Analyze>>>Descriptive Statistics>>>Frequencies.

Move the variables that you want to the Variable(s) box. Then, click OK.
These are the outputs:


5. STATISTICAL ASSUMPTION
Next, we checked whether the data is in normal distribution or not.

Click on Analyze>>>Descriptive Statistic>>>P-P Plots.

Move the variables you want to the Variables box.

Click on Options and tick on Mean, Std deviation, Kurtosis and Skewness. Then, click Continue

If the data is within the straight line, we can say that the data is normally distributed. As shown in the graph, though the data is slightly not on the straight line but it is still within the straight line. Therefore, we can say these data have normal distribution.
6. DESCRIPTIVE ANALYSIS

Click on Analyze>>>Descriptive Statistics>>>Descriptive.
7. INFERENTIAL ANALYSIS (CORRELATION)

Click on Analyze>>>Correlate>>>Bivariate.

Move the variable you want to the Variables tab. Then, tick on Pearson and Two-tailed.

Click on Options and then tick on Mean and Standard deviations. Then, click on Continue.
8. RELIABILITY ANALYSIS

Click on Analyze>>>Scale>>>Reliability Analysis.

Move the items for the scale that you want to check to Items box.

Click on Statistic and tick Item, Scale, Scale if item deleted and Correlations. Then, click on Continue.
C. REPORT
A Pearson product-moment correlation
was performed to test the relationship between social physique anxiety scores
and physical activity and sport anxiety scores. The data was analysed for
Pearson r with a significance value of 0.05 and two-tailed test to
determine if the data was statistically significant.
The
results showed that social physique anxiety scores and physical activity and
sports anxiety scores were significantly correlated, r(38)= +0.445, p<.05
(two-tailed). Pearson correlation showed that there is a weak and significant
positive relationship between social physique anxiety scores and physical
activity and sports anxiety scores. We can say that as social physique anxiety
scores increase, the physical activity and sports anxiety scores also increase.


REFERENCES
Leary, M. R.. (2013). Social Physique Anxiety Scale (SPAS). Measurement Instrument Database for the Social Science. Retrieved from www.midss.ie
Norton, P. J., Hope, D. A., & Weeks, J. W.. (2012). Physical Activity and Sport Anxiety Scale (PASAS). Measurement Instrument Database for the Social Science. Retrieved from www.midss.ie
Comments
Post a Comment